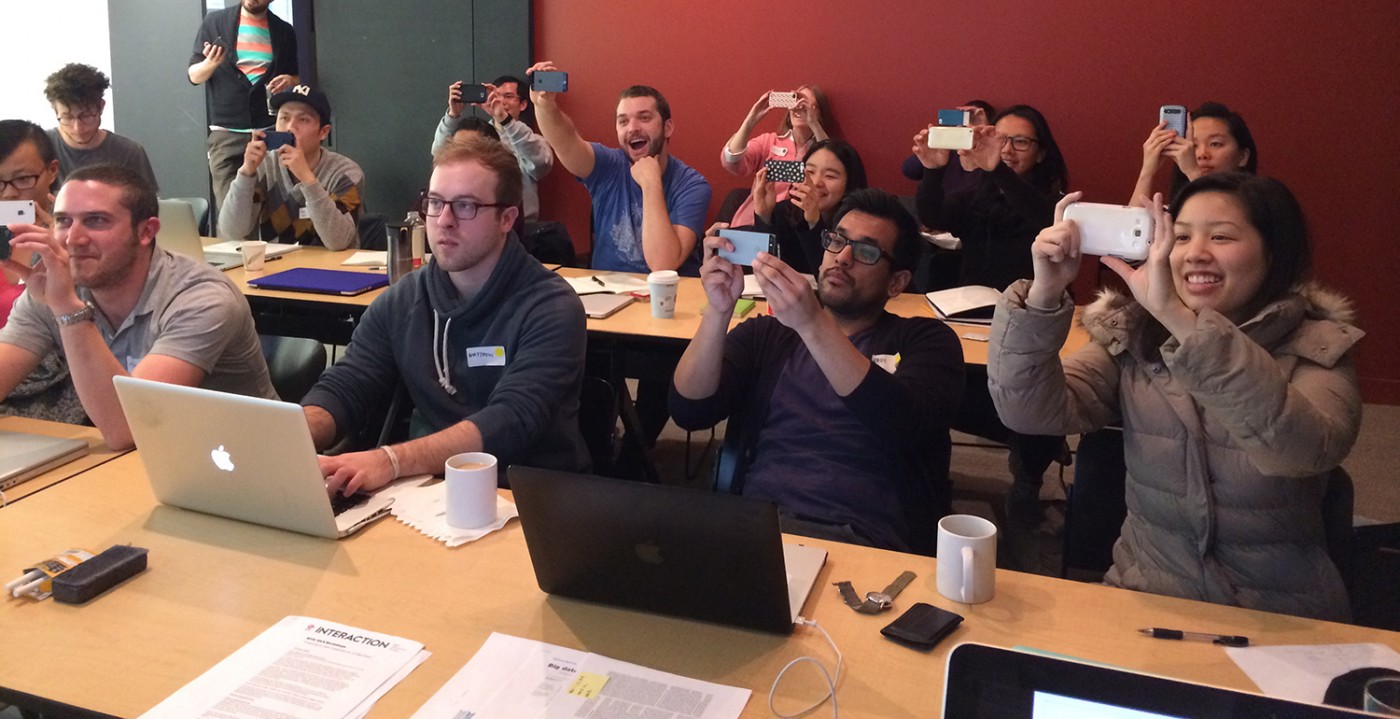
Four weeks, a dozen students, 24/7 transit
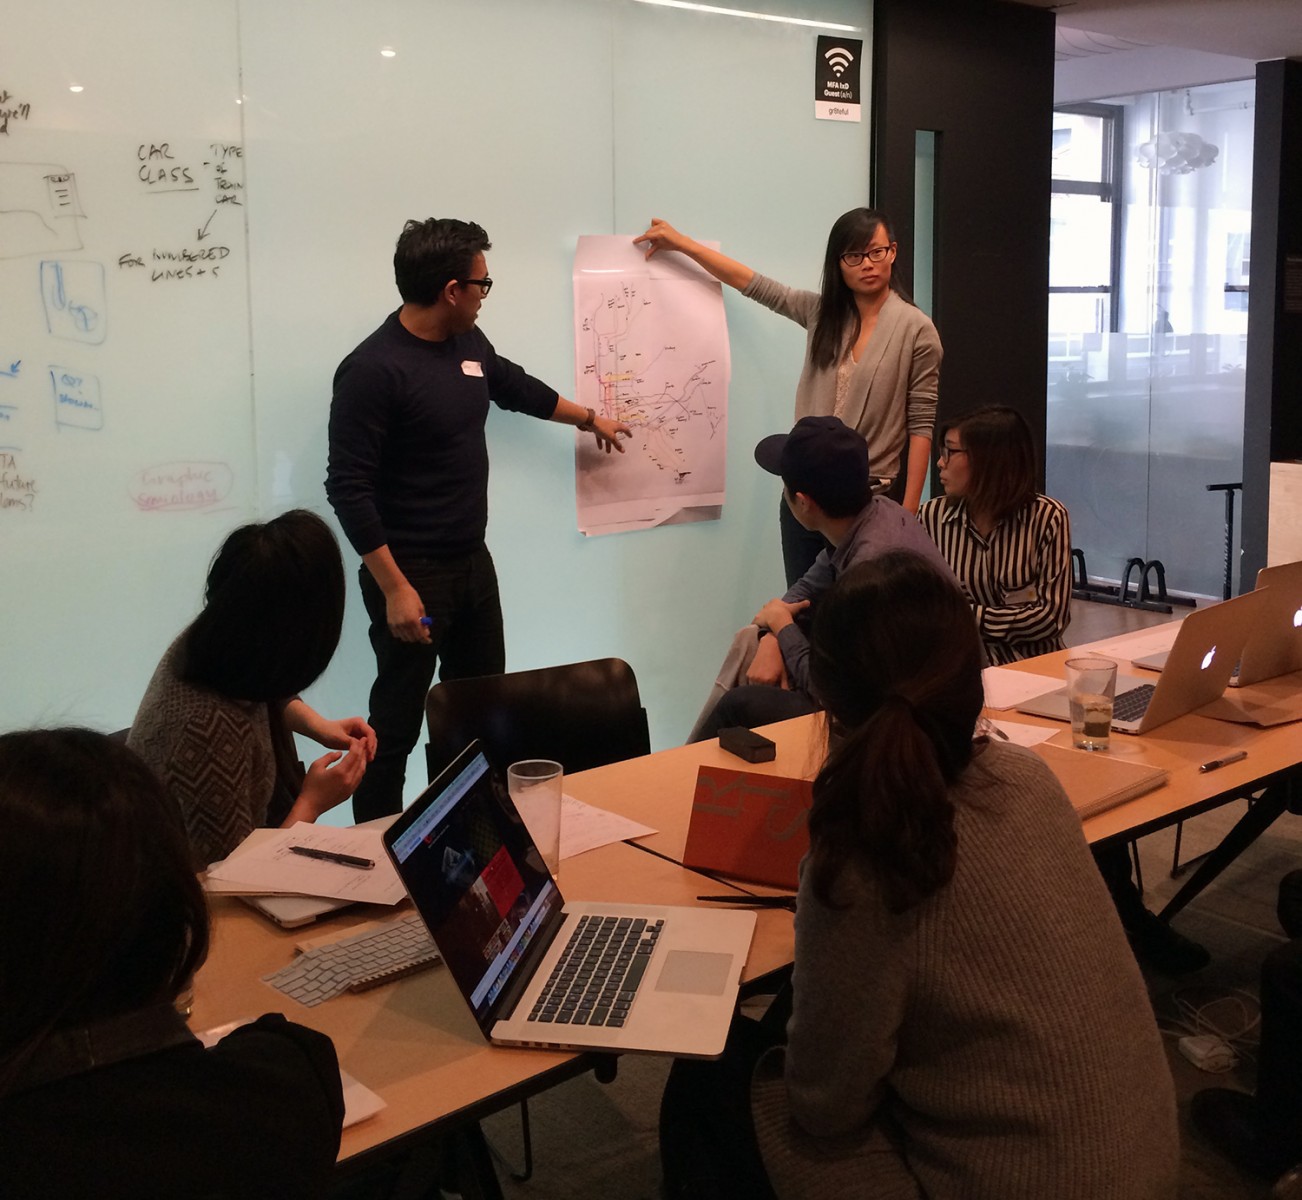
In early 2014, Turnstone’s Rachel Abrams facilitated a ‘big data’ visualization workshop at the School of Visual Arts Interaction Design (IXD) program, for and with the Metropolitan Transportation Authority (MTA).
Over four weeks, the MTA team and 13 first and second year grads waded into the depths of real New York City subway transit data, to make sense of the informational ‘exhaust’ of the world famous transit system.
Making meaning from data ‘exhaust’
Together, following a lightning-fast introduction to the agency’s objectives, key themes in data visualization, prototyping and transit planning, with master classes from Jen Kilian of Facebook and Eddie Opara of Pentagram, the students produced five data-driven, macro- and micro- stories about the life of the city’s infra- and info-structure.
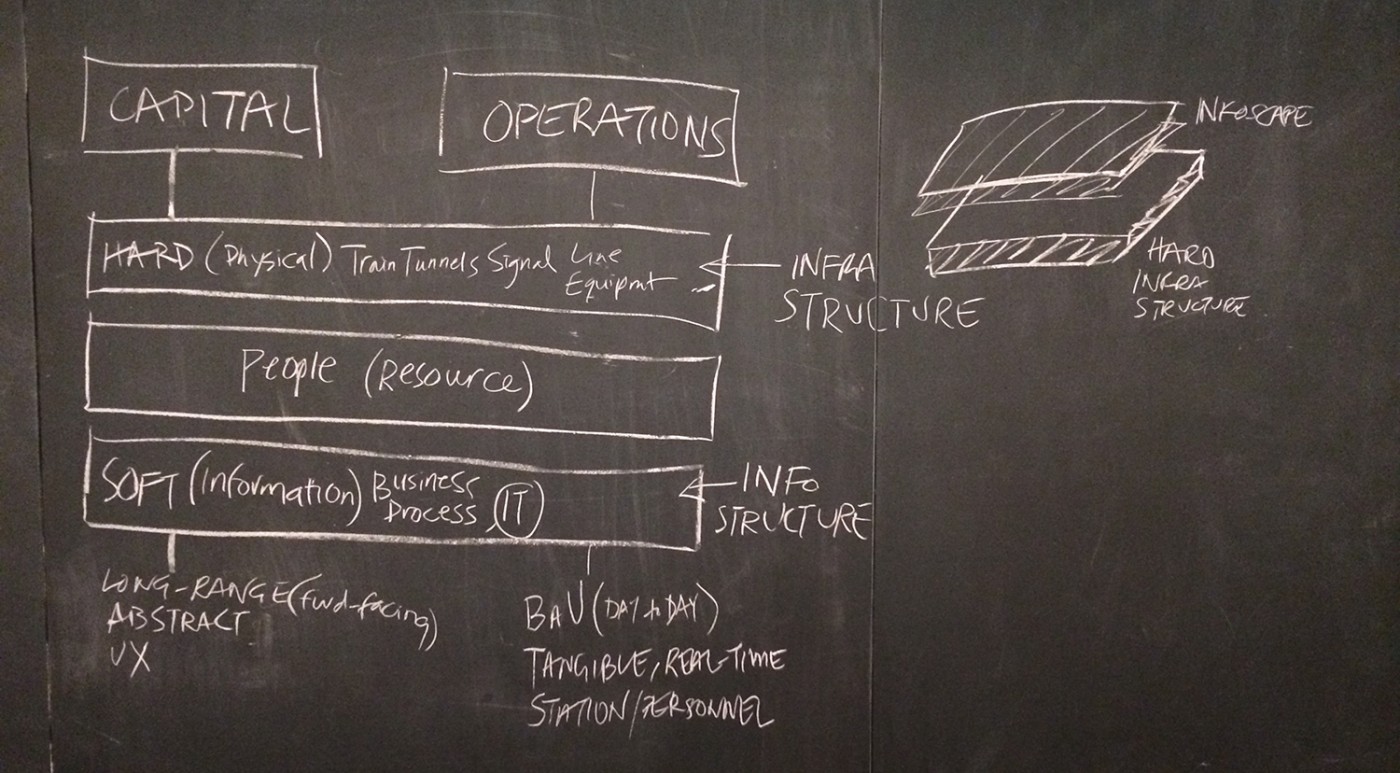
The info-structure of infrastructure
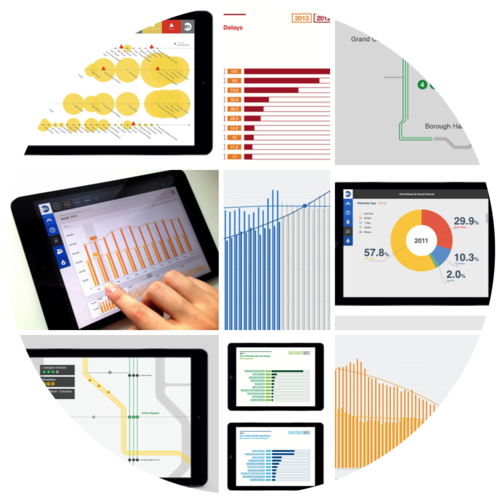
As this comprehensive summary of the workshop captures, projects covered five related topics, drawn from the informational exhaust that NYC subway trains spew every minute of every day. Students:
- Identified the top ten causes of delays during Monday morning rush hour
- Compared overall reliability of two manufacturers’ cars (train rolling stock)
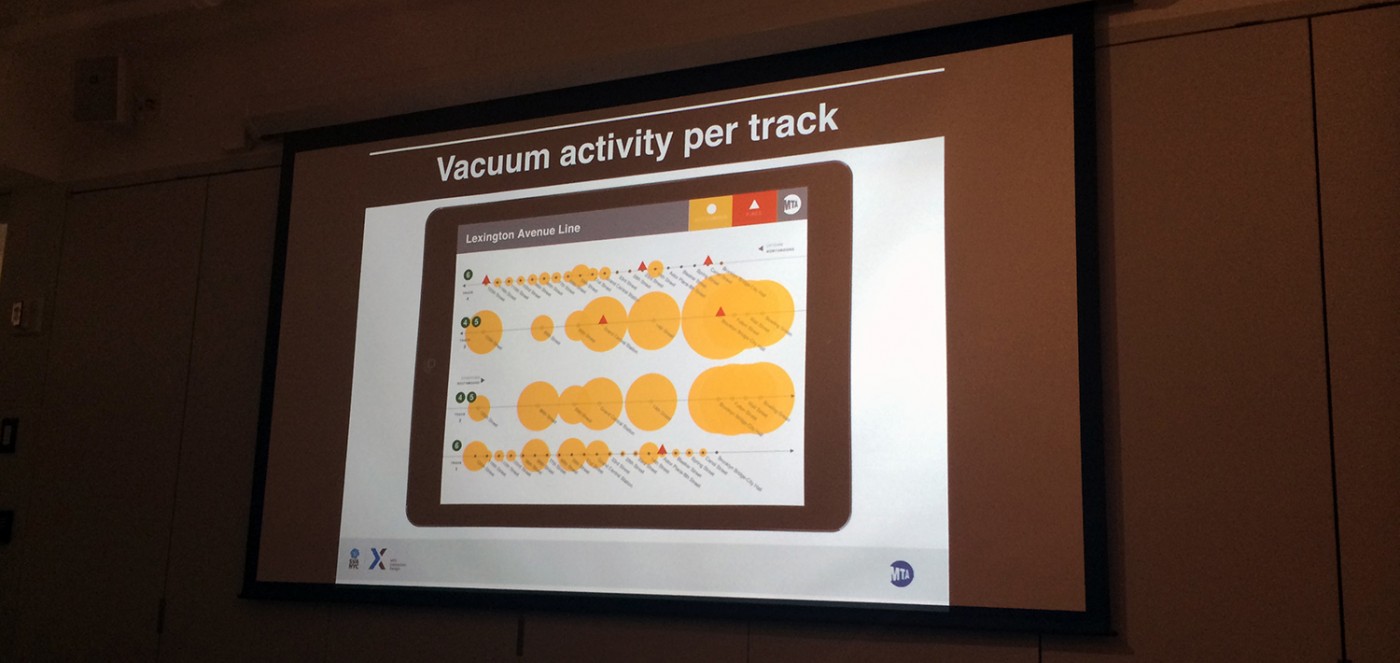
- Investigated whether effective garbage collection reduces the frequency of track fires
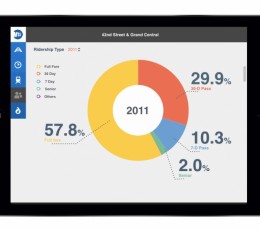
- Profiled a single station within the network, segmenting ridership by fare type
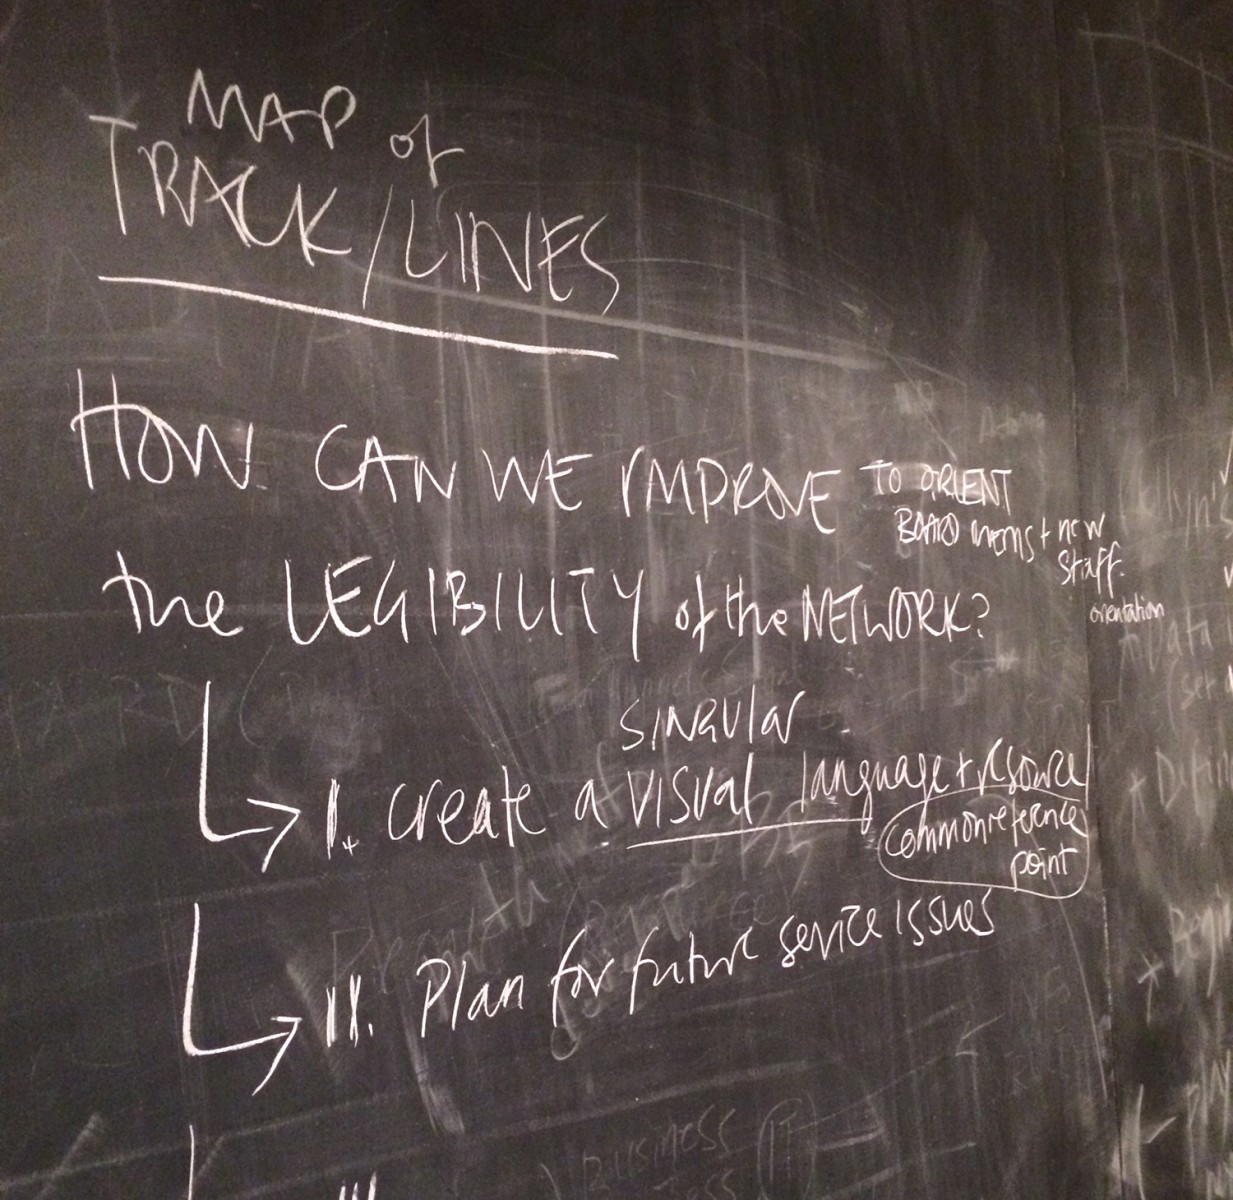
- Developed a common reference and visual vocabulary for identifying sections of track by line across the entire network (are you on the Culver or the 6th Ave section of the F?)
Recommendations for the MTA
With and for the MTA, we also made some key recommendations for their benefit, moving forward, including:
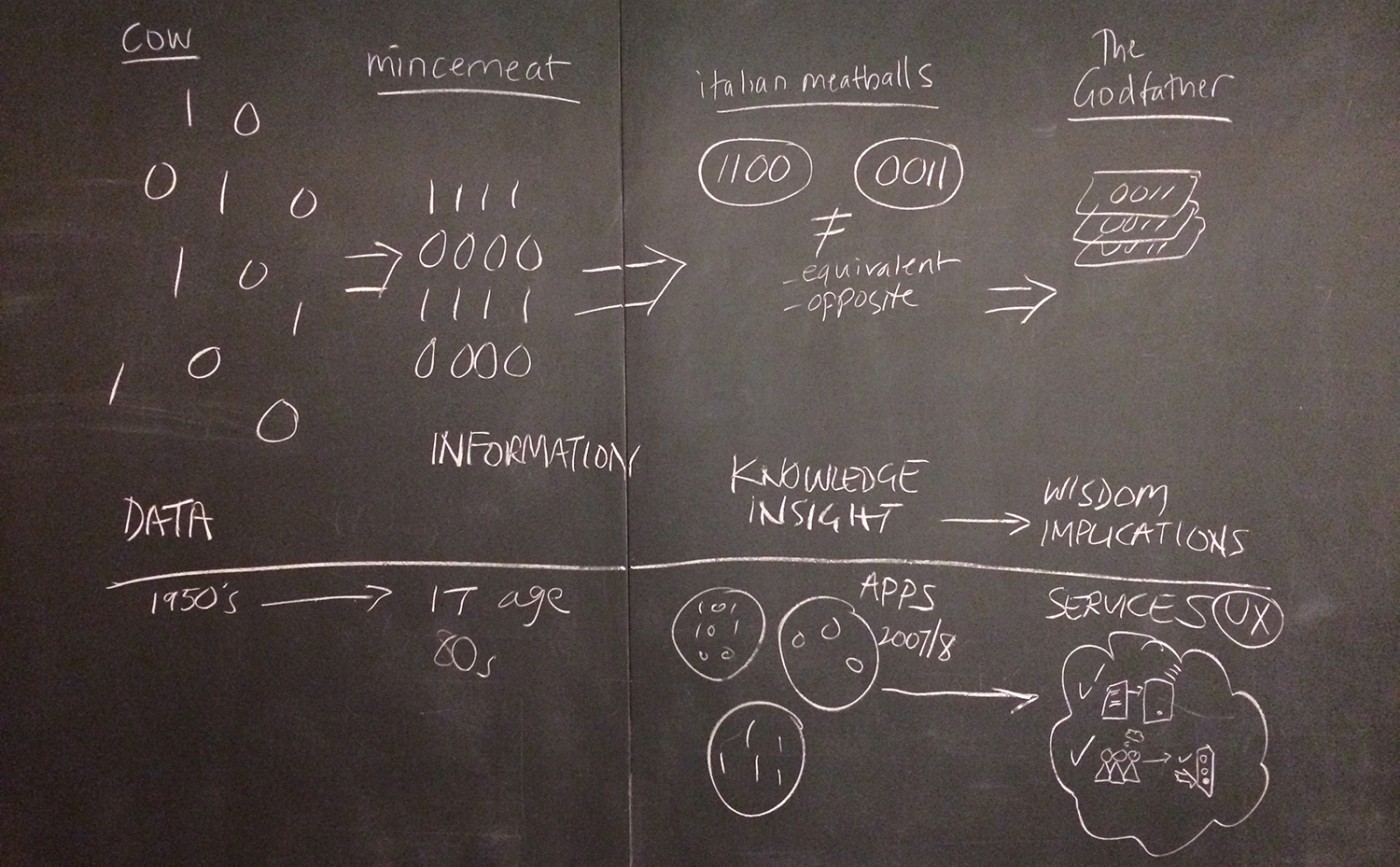
- Recognize that what makes data glorious is that it’s the raw material of evidence: Key to making cases that guide decisions
- Start with just enough data, clean it, structure it. Identify what decision-makers really need to know, and collect data to support just that.
- Remember that user-centered design means start with decision-makers’ and operators’ real needs and establish a common visual grammar and vocabulary everyone can use
- Limit jargon and acronyms: Use simple language regular people can understand
- If you can’t draw conclusions, spot outliers, tendencies and patterns that send the data analysts on a new hunt
- Engage users of visual data progressively: Start by establishing those visual basics, then build up layers of complexity from there to tell the full story.
- Consider scale – showing macro and micro views reveals details in a big picture.
- Develop scorecards and personas as an excellent way to summarize attributes of an issue and of typical users
- Appreciate getting stuck: Identifying what’s missing can provide useful clues
- Develop standards for collecting, organizing and representing content. These are all critical for managing data
- Tell a story for people, not data for data’s sake
and finally:
- Like gold, the value of data is not in mining it, but in smithing it: You hear the announcer warn that trash starts fires and causes delays because we spun the data-driven story to say so.
Laying tracks for UX culture in transit
The public sector has a long way to go before it embraces strategic user experience (UX) design, a people-centered experiential view of the complex systems it runs.
That approach is going to help them cut through the silos that are firmly entrenched in daily operations and maintenance of hard infrastructure. It would reveal and allow them to apply insight about the system and communicate that knowledge internally and to the riding public more effectively. It would save the authority money in the long term.
The President of the MTA and the US Secretary of Transportation, Anthony Foxx, learned of and praised the students’ work and the actionable agenda for MTA best practice.